SQL Server Performance Counter Data collection using TypePerf utility
https://dbamantra.com/wp-content/uploads/2018/02/TypePerf-1.jpgSQL Server performance tuning and Optimizing SQL Server is part of the day to day job of a Database administrator. One of the key aspects of Performance tuning is to gather performance counters data on the Database server for CPU utilization, Memory and Disk usages along with SQL Server related Metrics. The benefit of performance data collection is that it helps the Database professionals to create a baseline of the resource utilization of SQL Server and Operating system in an ideal scenario. We have so many third party tools available in the market through which we can create Performance Data collection repository which automatically provides us baseline reports and performance reports. Some of these tools are SQL Monitor (Red Gate), SQL Sentry Performance Advisor (SentoryOne) etc.
However there are few situations in which we don’t have the luxury of using Third-party software due to Budget constraints, then we have to look up for such tools which are free of cost and perform the same kind of tasks. For example Performance Counters, TypePerf, SQL Server DMVs etc.
Today I will discuss the Benefits of Typeperf tool and how can we utilize this tool to capture the performance data into a SQL Server table.
Typerf.exe – Performance Data collector utility
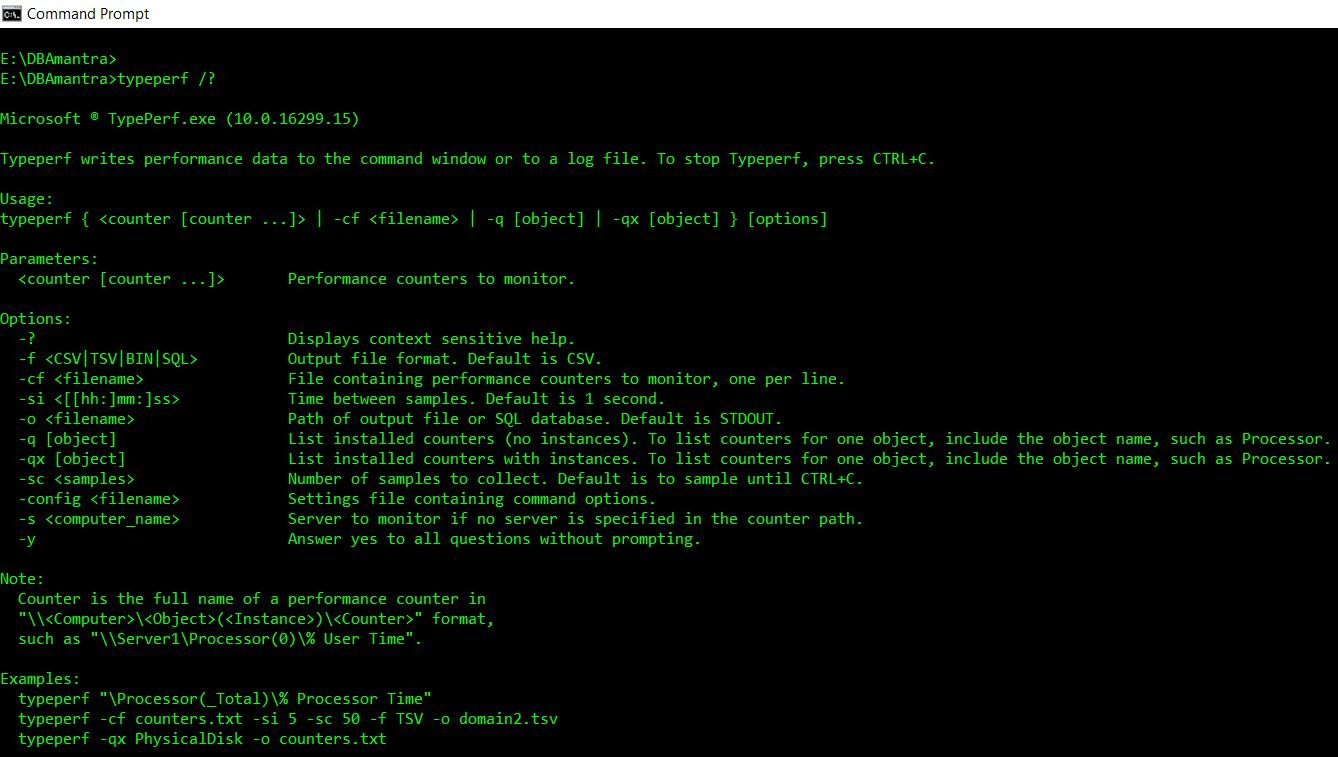
TYPEPERF.exe is a command line utility offered with Microsoft Windows platform through which we can collect the data in a file or SQL Server Database table. This utility captures the Performance data from Performance counters which are available in Windows Operating system. Typeperf.exe utility offers various parameter which can be utilized to capture performance counter data into an output file or in a SQL Server tables.
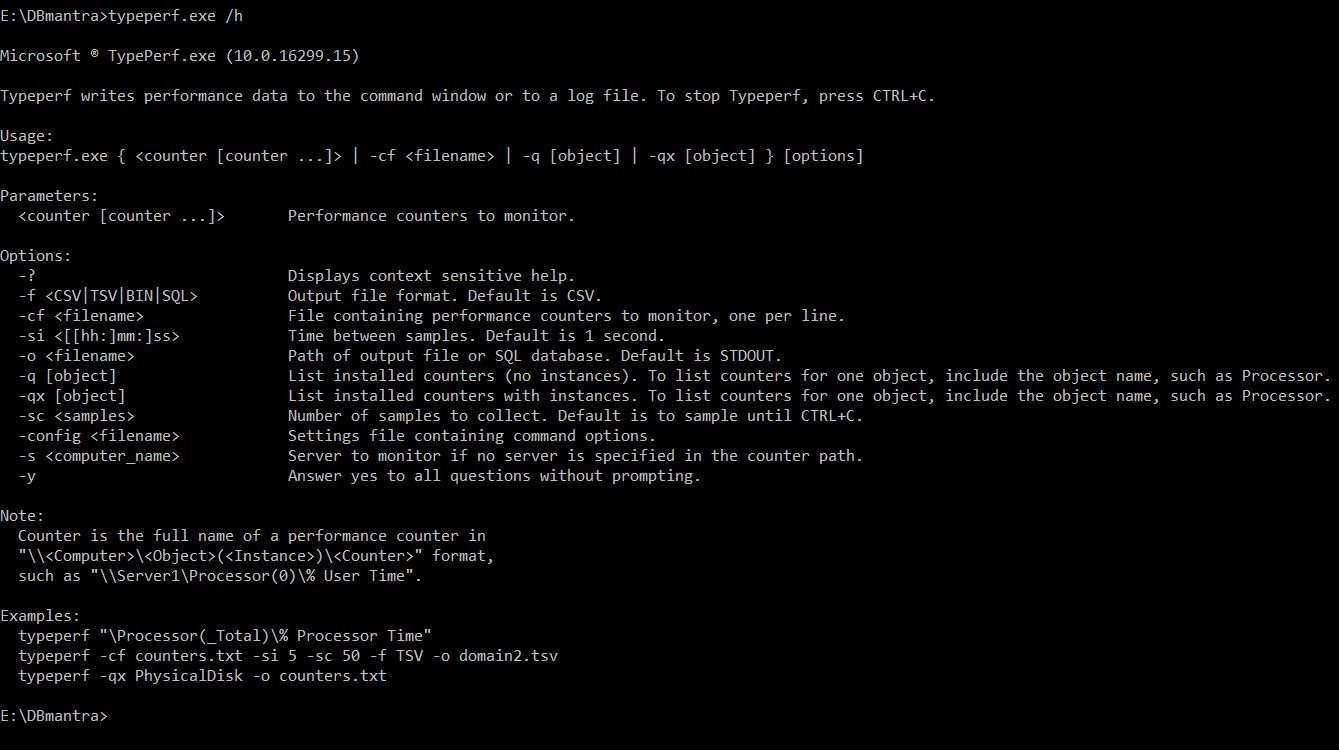
The best part of this utility is, it provides the functionality of collecting SQL Server related performance counters as well. Another best feature of this utility is, we can capture the Performance counter data into pre-formatted tables.
Usages of Typeperf.exe
Here are some examples of using typeperf.exe to capture the Performance counter data.
- We can use below parameters to showcase memory and processor related counters.
typeperf "\Memory\Available bytes" "\processor(_total)\% processor time"
 2. Below command can be used to dump the Explorer process counters after every 5 seconds in a CSV file.
typeperf "\Process(Explorer)\Thread Count" -si 5 -o typeperf.csv


3. We can use below command to collect 50 samples of the counters listed in the file counters.txt, at sample intervals of 120 seconds.
typeperf -cf counters.txt -si 120 -sc 50 -f TSV -o samples.csv
Note: you have to add the performance counter details in the counters.txt file to capture the data.
As per my experience, I do not like to dump the data into CSV file. Following this process, We have to dump the data into CSV first and then work on the data to make it more presentable to the teams.
Hence, It will be good option to collect the Performance counters data into a SQL Server table through which we may generate reports, graphs etc. to present it to the various teams for Capacity planning or troubleshooting performance issues.
Let’s check, how we can collect the Performance counter data into SQL Server tables.
How to collect Performance counter data into SQL Server tables using Typperf.exe ?
To collect the Data in SQL Server tables we need to perform steps.
- Setup a database in a SQL Server instance
- Setup an ODBC connection to the SQL server instance through which data will be inserted into the tables
- create a counters.txt file to specify the counter details for which data will be collected
- Setup a SQL Server job to run the TypePerf.exe utility with appropriate parameters to collect the data and insert into the SQL Server database tables
Step 1: Create a database into SQL Server instance with the name dbadmin to insert Performance counters data into tables.

CREATE DATABASE [dbadmin]
 ON  PRIMARY
( NAME = N'dbadmin',
FILENAME = N'D:\SQL2016\MSSQL13.SQL2016POC\MSSQL\DATA\dbadmin.mdf' ,
 SIZE = 8192KB , FILEGROWTH = 65536KB )
 LOG ON
( NAME = N'dbadmin_log',
FILENAME = N'D:\SQL2016\MSSQL13.SQL2016POC\MSSQL\DATA\dbadmin_log.ldf' ,
 SIZE = 8192KB , FILEGROWTH = 65536KB )
GO
Step 2: Create an ODBC connection which points to the SQL Server instance.
 Select ODBC Driver for SQL Server and click on Finish. Assign a name to the ODBC connection and mention the SQL Server instance in which performance data will be collected.

Select the appropriate Authentication based on your requirement.

Select the database name and click next.
 Click on Finish to complete the ODBC connection setup.

Step 3: Once the ODBC connection is created, create a Counters.txt text file on any of the disk drive on the server which will contain Performance Counters information for which data will be collected.
Sample performance counters for which data will be captured are:
 \Processor(*)\% Processor Time
 \Memory\Available MBytes
 \PhysicalDisk(* *)\Avg. Disk Queue Length
 \PhysicalDisk(* *)\Avg. Disk sec/Read
 \PhysicalDisk(* *)\Avg. Disk sec/Write
 \PhysicalDisk(* *)\% Disk Time
 \PhysicalDisk(* *)\Disk Reads/sec
 \PhysicalDisk(* *)\Disk Writes/sec
 \MSSQL$SQL2016POC:Buffer Manager\Buffer cache hit ratio
 \MSSQL$SQL2016POC:Buffer Manager\Page life expectancy
 \MSSQL$SQL2016POC:Buffer Manager\Buffer cache hit ratio
 \MSSQL$SQL2016POC:General Statistics\User Connections
Note: Since I am using a Named Instance for this data collection i.e. why I mentioned SQL Server instance name (\MSSQL$SQL2016POC: Buffer Manager\Buffer cache hit ratio) for the performance counter. In case of Default instance, below performance counter will be used.
\SQLServer: Buffer Manager\Buffer cache hit ratio
I have taken a sample of SQL Server and Operating system performance counters for the illustration purpose. We may add more counters as per the data collection requirement.
Step 4: Create a SQL Server Agent job to collect the data into the SQL Server database and run it every 5 minutes based on the requirement of data collection.
The command which will be used to fetch the performance counters data is:
TYPEPERF -f SQL -s DESKTOP-I0VT53E -cf "E:\DBAmantra\counters.txt" -si 15 -o SQL:PerfMon!log1 -sc 4
-s Computer Name
-cf counter information file
-si sample interval
-o SQL ODBC connection
-sc number of time sample collection
Once the Job is created and scheduled to run, Job will create three tables in the specific database ie. dbadmin.
dbo.CounterData
dbo.CounterDetails
dbo.DisplayToID
You may get more details about the above table structure in Microsoft documentation.
Now we have data collection in the SQL Server tables and analysis it to troubleshoot any kind of performance issue.
The following query can be used to fetch useful information about the data for troubleshooting purpose.
SELECT
CDT.MachineName
    ,CDT.ObjectName
    ,CDT.CounterName
    ,CDT.CounterType
    ,CDT.DefaultScale
    ,CDT.InstanceName
    ,CONVERT(DATETIME,SUBSTRING(CDA.CounterDateTime,0,16))  AS CounterMinute
    ,MAX(CDA.CounterValue) AS MaxValue
    ,MIN(CDA.CounterValue) AS MinValue
    ,AVG(CDA.CounterValue) AS AvgValue
FROM
    dbo.CounterDetails AS CDT
JOIN
    dbo.CounterData AS CDA
ON
   CDT.CounterID = CDA.CounterID
   GROUP BY
   CDT.MachineName
   ,CDT.ObjectName
   ,CDT.CounterName
   ,CDT.CounterType
   ,CDT.DefaultScale
   ,CDT.InstanceName
   ,CONVERT(DATETIME,SUBSTRING(CDA.CounterDateTime,0,16))
However, we may also create SQL Server reports to aggregate the data and troubleshoot the performance related issues.
Along with this, we should also create an SQL Server agent job to archive the old data to accommodate space for new data and eliminate any issues of Database related space.
Conclusion:
This is how we may use Typerf.exe utility to fetch the Performance-related data for troubleshooting performance issues or for capacity planning. We can also collect the data into a centralized SQL Server instance and create meaning out of the raw data.